
HedgeIOT: Grafana Dashboard with a Scalable UI API Layer
In HedgeIOT, I worked on the monitoring and exploration layer: a Grafana dashboard backed by a dedicated UI API.
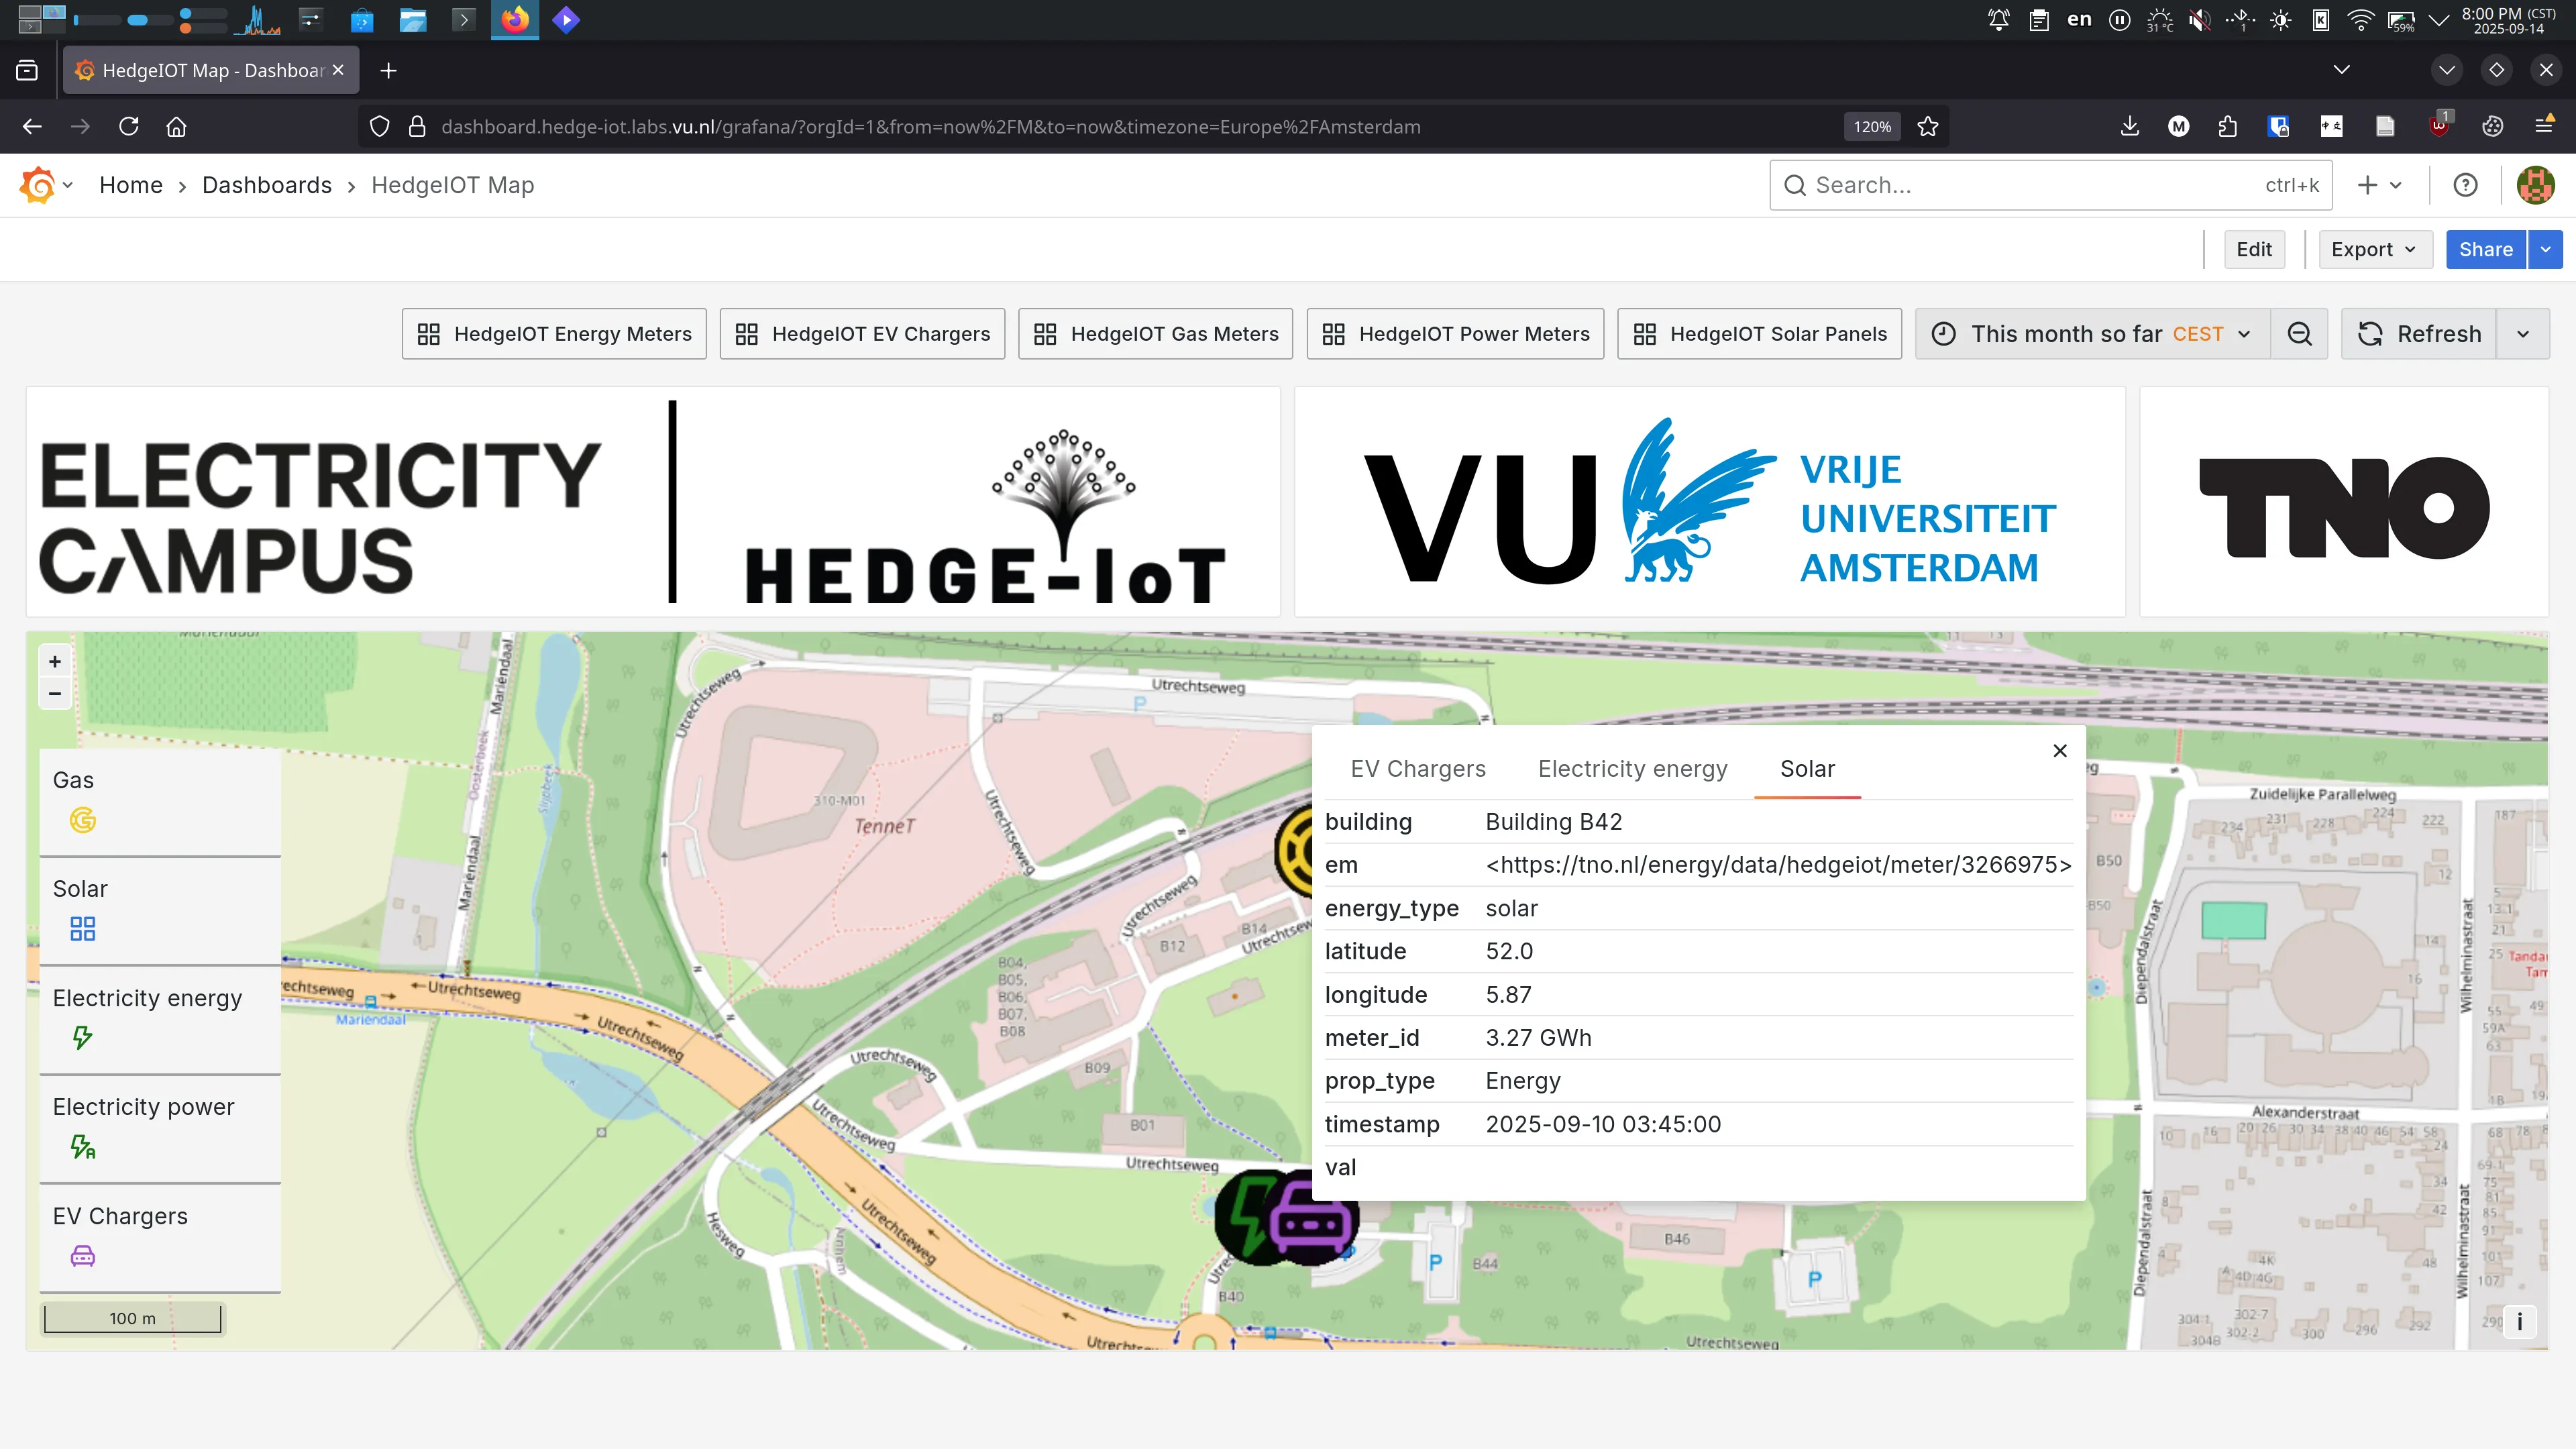
Instead of coupling Grafana panels directly to static data sources, I designed the API layer so the dashboard could adapt as new meter types and categories were introduced. For technical implementation details like dynamic meter discovery or normalization logic, please see the GitHub repository linked below.
Project Scope
Repo: https://github.com/VU-HedgeIOT/HedgeIOT_Dashboard
Core capabilities I implemented:
- Integration with the Knowledge Engine through ASK interactions
- Dynamic meter discovery
- Measurement normalization for dashboard consumption
- Caching of expensive calls for better responsiveness
- Template-based dashboard generation for multiple meter categories
Architecture Decisions
1) Keep Grafana thin, keep API smart
I pushed discovery and normalization logic into the UI API so Grafana panels could stay simple and reusable.
2) Avoid hard-coded meter assumptions
Meter discovery prevents dashboard logic from breaking when inventory evolves. This made the system more robust in real deployments.
3) Add performance controls where they matter
Caching reduced repeated expensive operations and improved dashboard responsiveness for stakeholders.
Technical Challenges I Solved
- Bridged semantic knowledge interactions with dashboard-ready outputs
- Normalized heterogeneous measurements into panel-friendly structures
- Designed for change by removing static meter dependencies
- Balanced maintainability with operational performance
Outcome
The final dashboard became easier to operate and extend over time, rather than a one-off visualization tied to a fixed sensor list.
For employers, this project showcases product-minded backend and data engineering: system integration, API design, observability UX support, and scaling considerations.